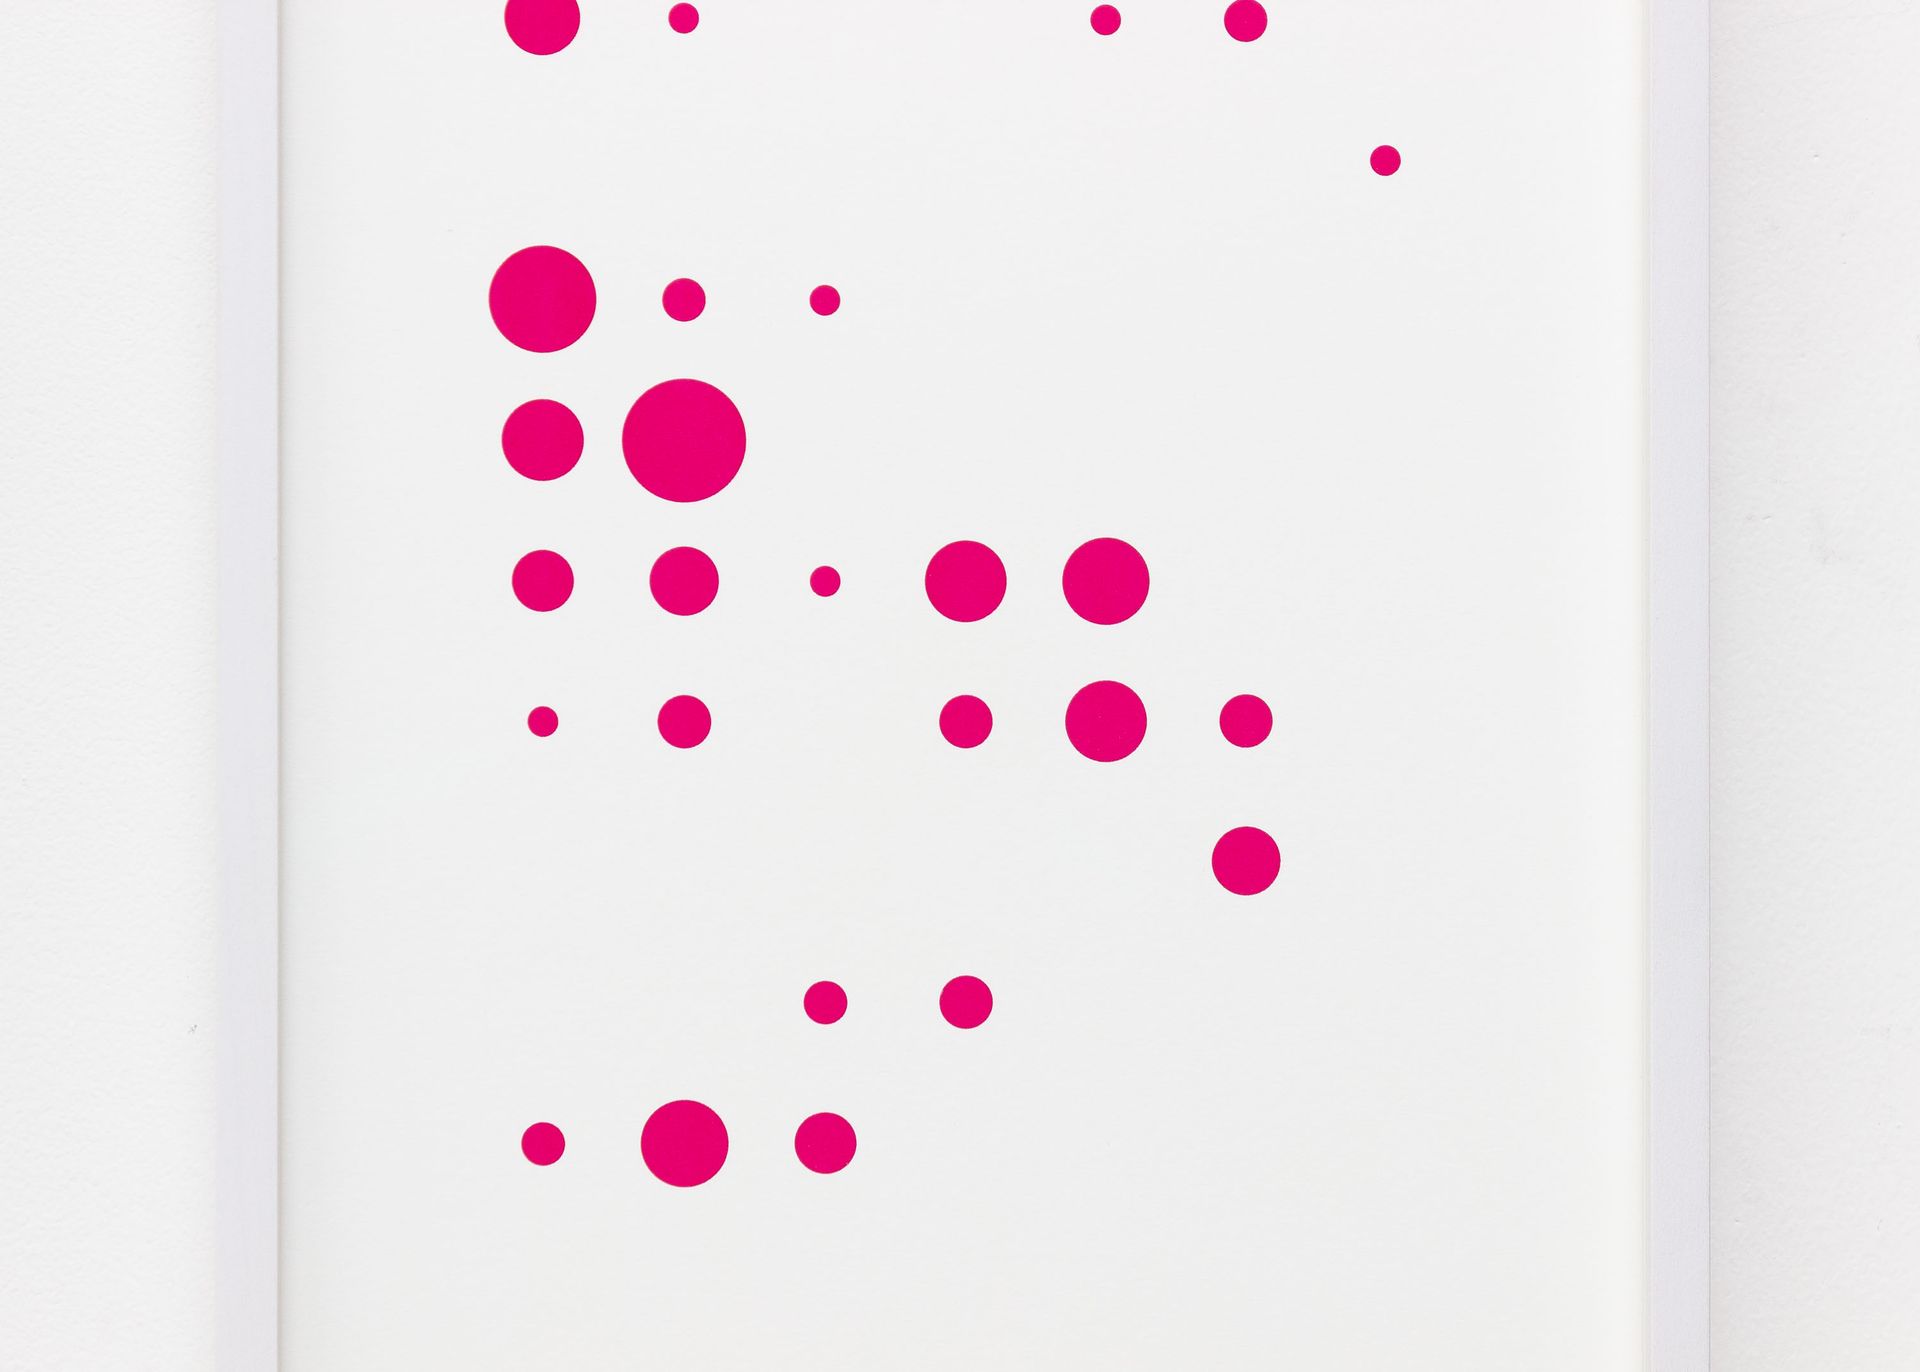
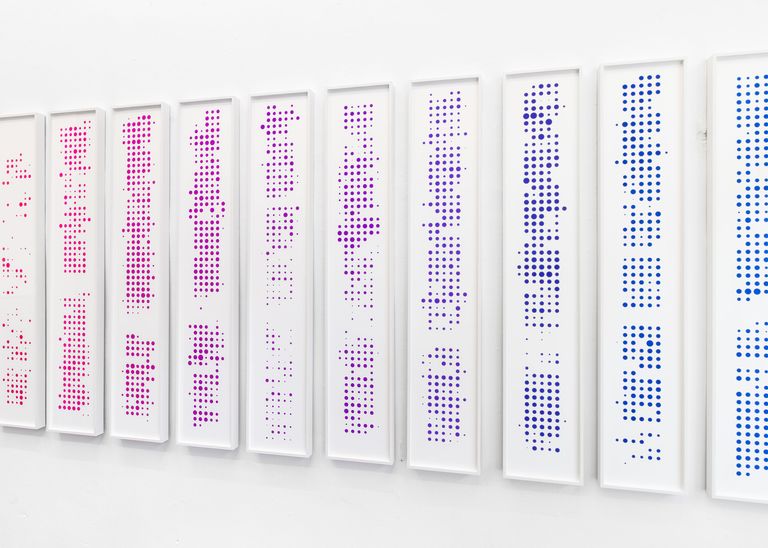
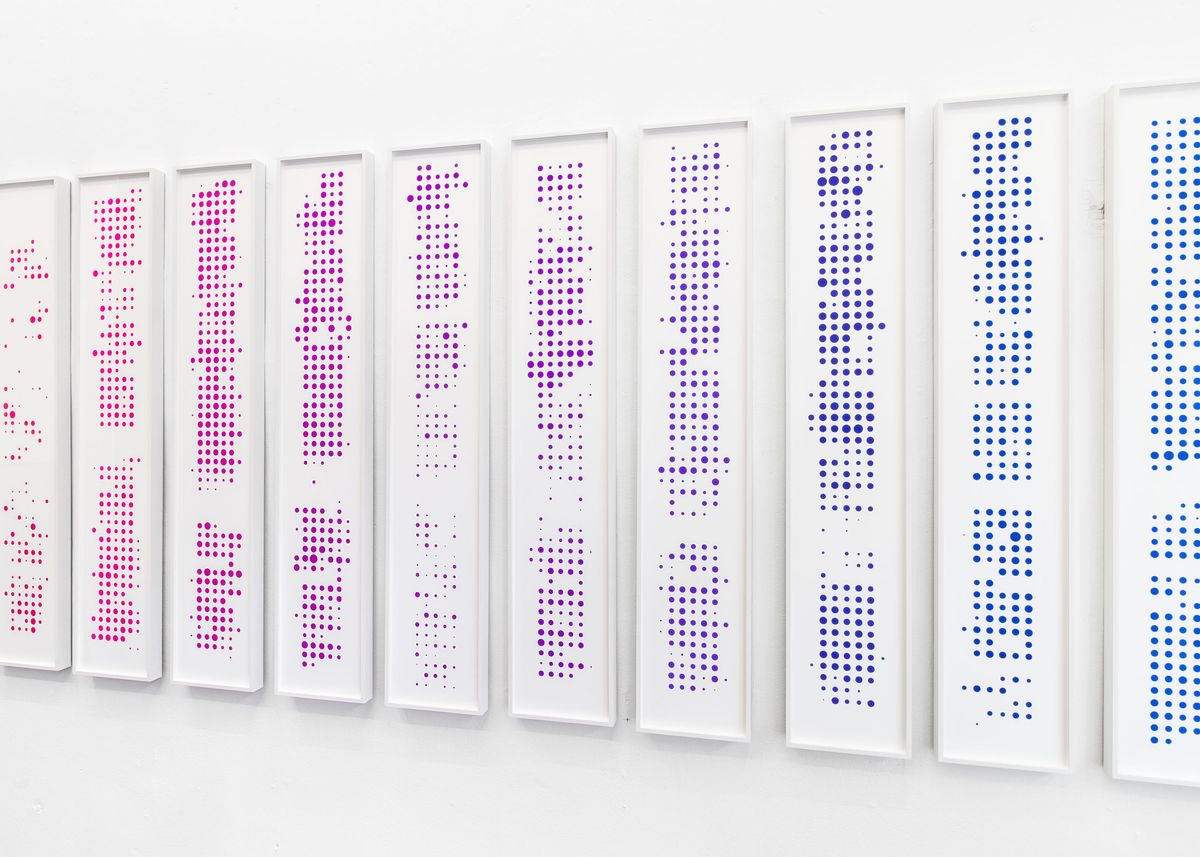
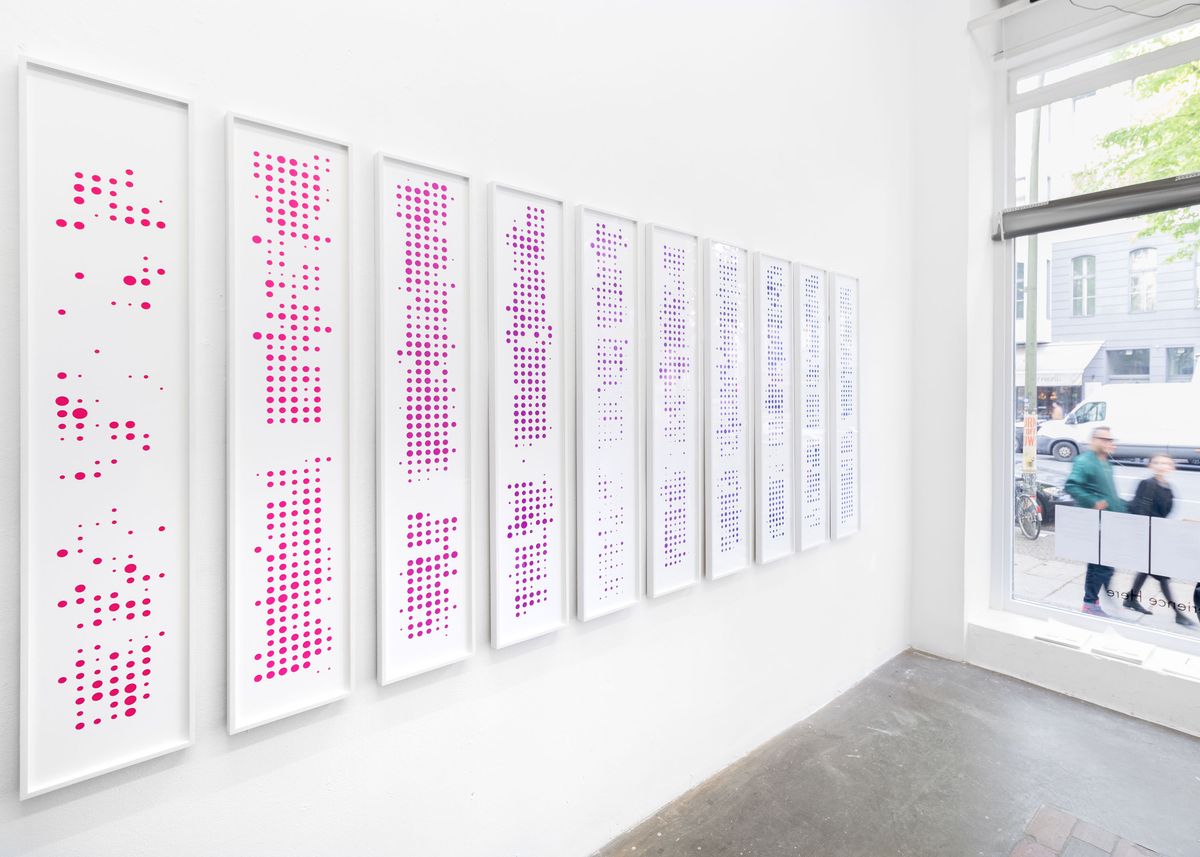
The *Activity Tableau* series transforms Carsten Becker's digital work time documentation into analog screen prints. Each portrait-format panel visualizes one calendar year as a systematic dot grid: 52 horizontal rows represent the weeks, organized from Sunday (left) to Saturday (right). Each dot's radius corresponds to daily work time – the larger the dot, the longer the workday. Colorless areas mark work-free periods.
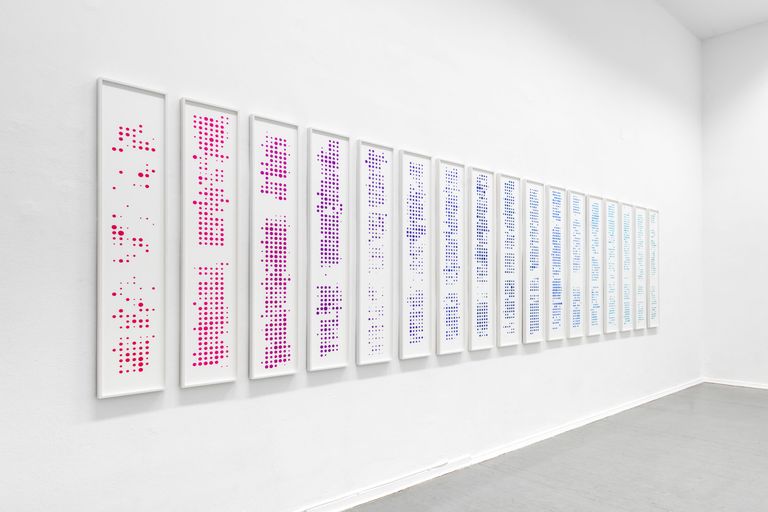
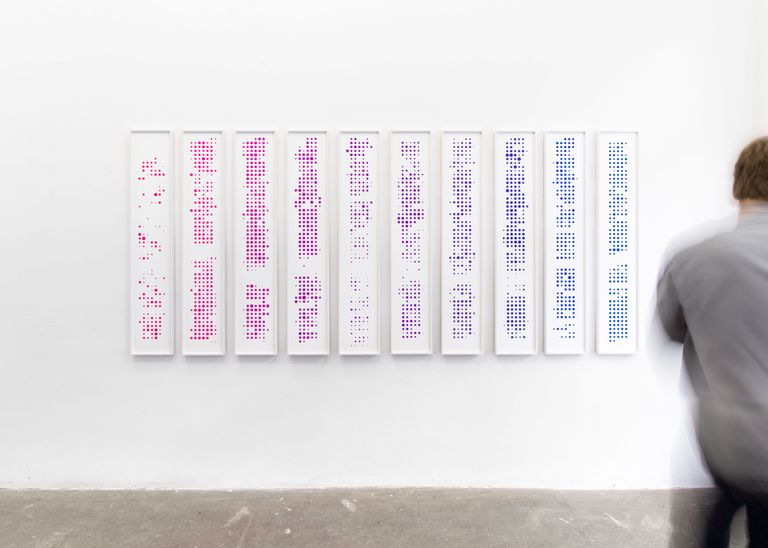
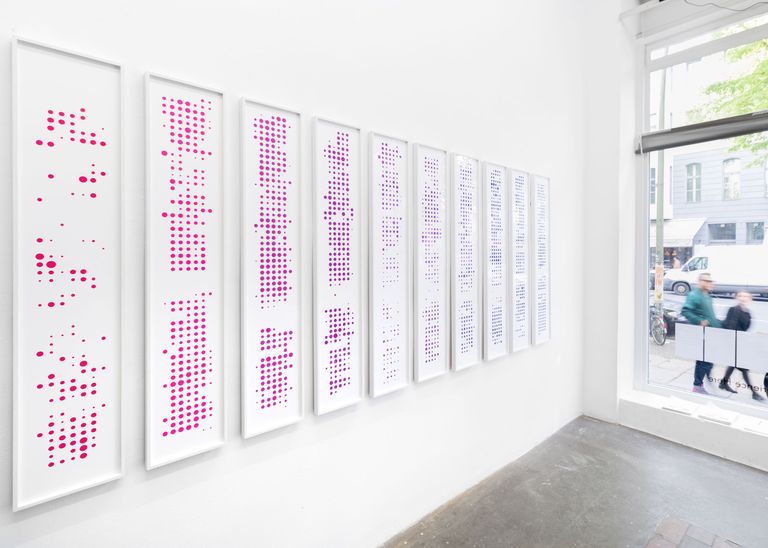
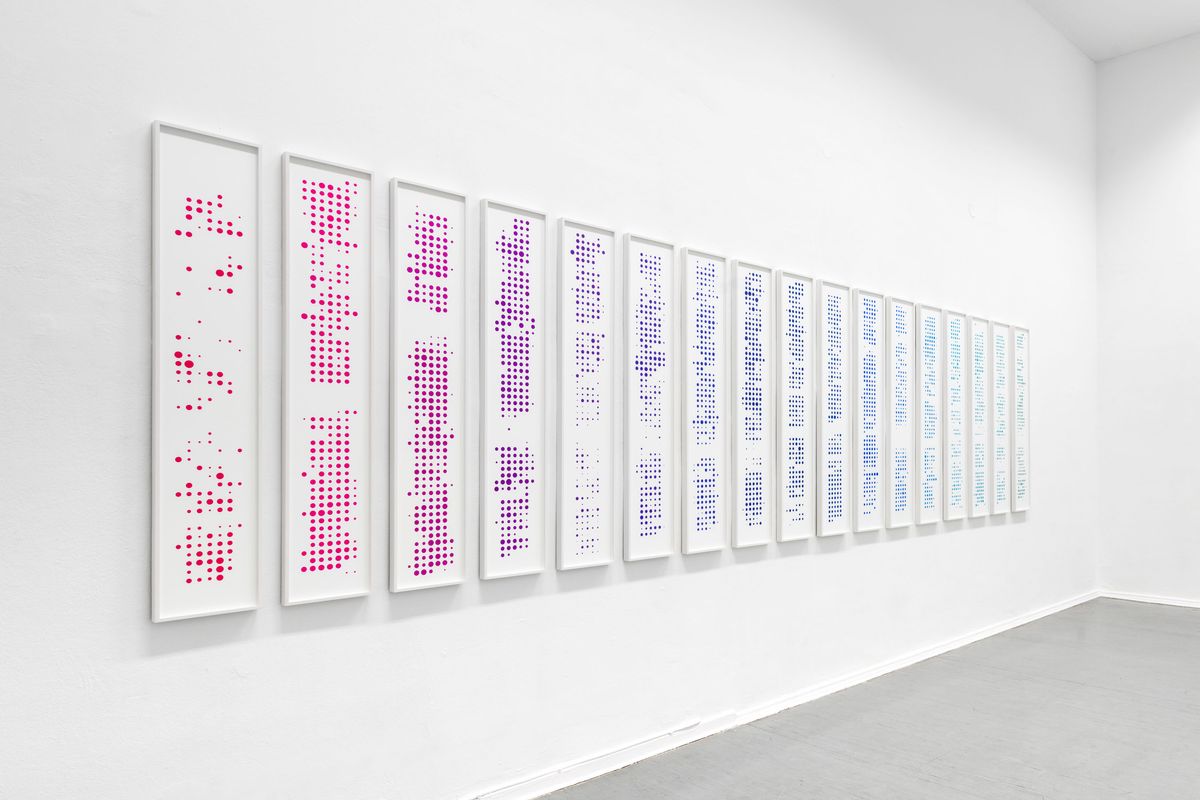
The chronological arrangement over two decades reveals biographical development: while early years show fragmented, irregular patterns, dots increasingly condense into denser structures. The color progression follows the light spectrum – from purple-magenta as initial color through violet, blue, green, yellow to warm red tones. This seemingly positive rainbow aesthetic conceals the underlying system of self-control.
The twenty-year series makes visible the successive transition to an optimized work regime and reflects the internalization of capitalist efficiency logic as an aesthetic phenomenon of self-discipline.
The Activity Tableau series transforms Carsten Becker's digital work time documentation into analog screen prints. Each portrait-format panel visualizes one calendar year as a systematic dot grid: 52 horizontal rows represent the weeks, organized from Sunday (left) to Saturday (right). Each dot's radius corresponds to daily work time – the larger the dot, the longer the workday. Colorless areas mark work-free periods.