Activity Tableau
2015–2018
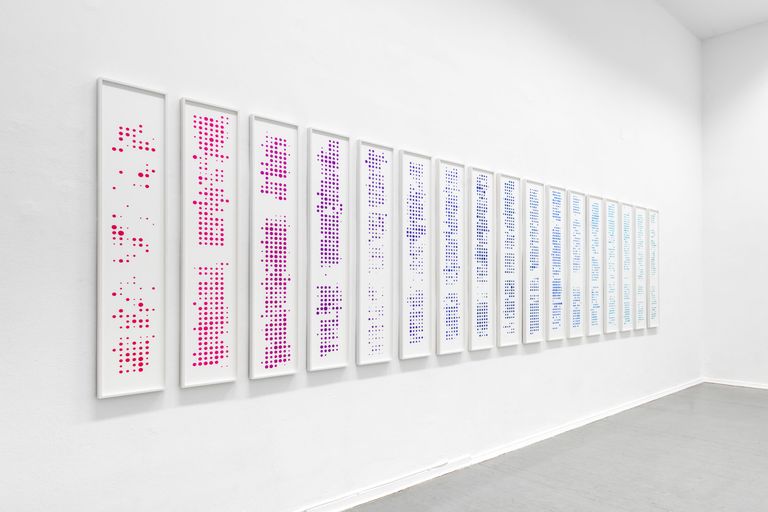
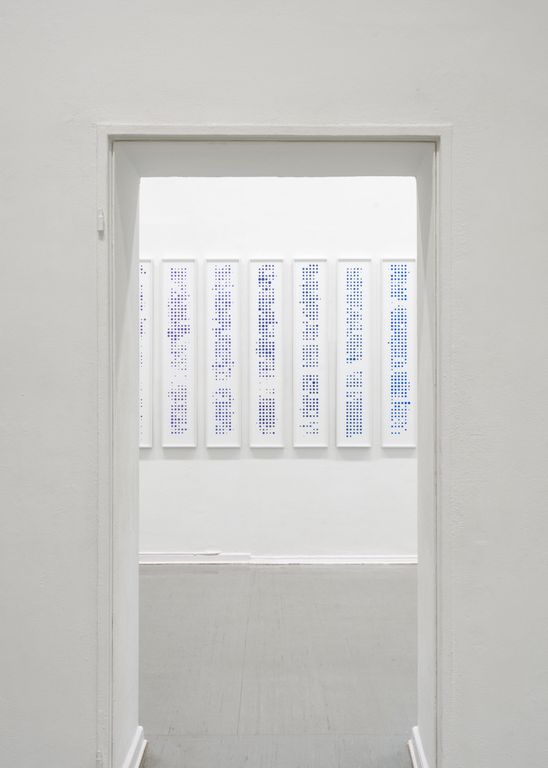
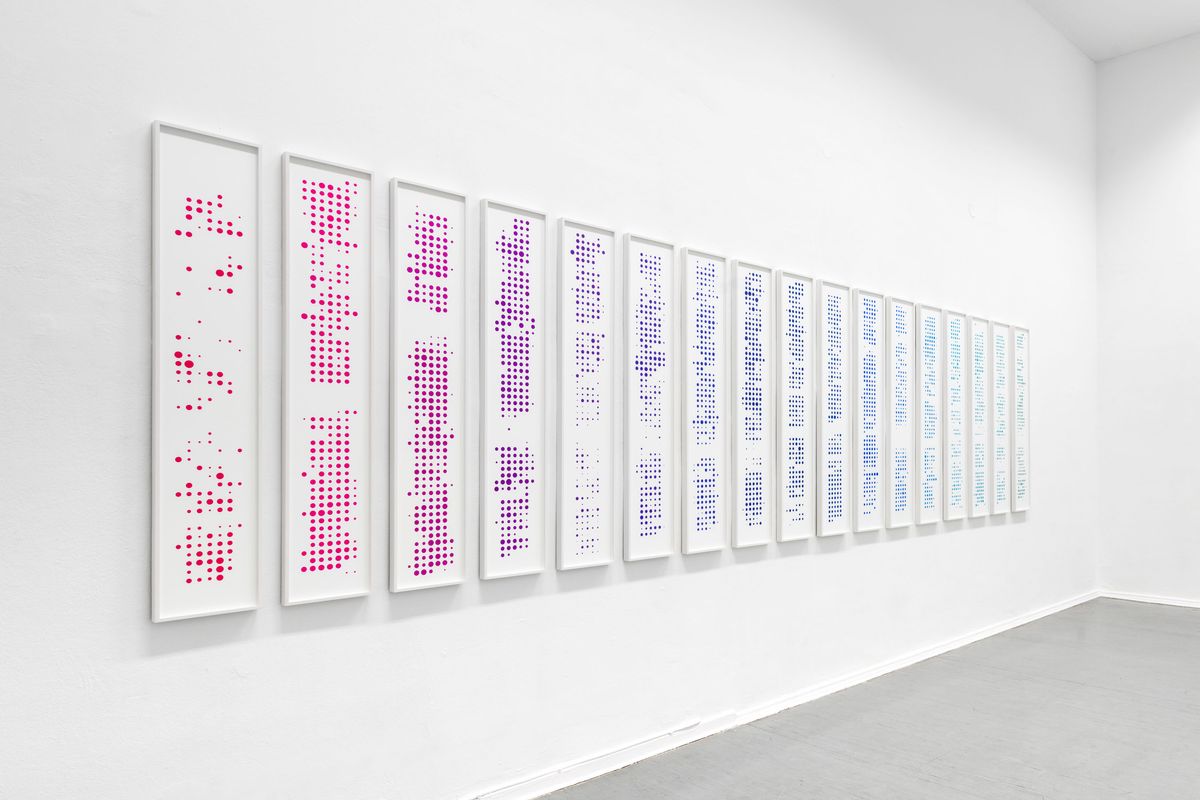
The Activity Tableau series transforms Carsten Becker's digital work time documentation into analog screen prints. Each portrait-format panel visualizes one calendar year as a systematic dot grid: 52 horizontal rows represent the weeks, organized from Sunday (left) to Saturday (right). Each dot's radius corresponds to daily work time – the larger the dot, the longer the workday. Colorless areas mark work-free periods.
Installation Views
Photo: Henrik Strömberg
Texts on the Series
Tamara Branovic, 2017
Becker’s main interest lies in the measurability of human activity, with its potential market value and economic significance. Digital exhibitionism – the detailed display of our lives – simplifies access to, and regulation of, human behaviour. The pattern of Becker’s work ethic emerges like a fingerprint – yet only he has an emotional connection to it.


